Household Gas Prices Continue to Grow Faster than Electricity, Stressing Budgets in the Winter Months

Utility bills are soaring across the country and the need to address energy affordability is becoming increasingly pressing. The conversation, however, is often missing an important part of the equation: the gas that 74 million U.S. households use for heating, hot water, and cooking. [1] Residential electricity prices have made headlines by growing nearly 33 percent since 2019,[2] outpacing inflation. But average national residential gas prices have grown even faster: over 46 percent during the same time period.[3]
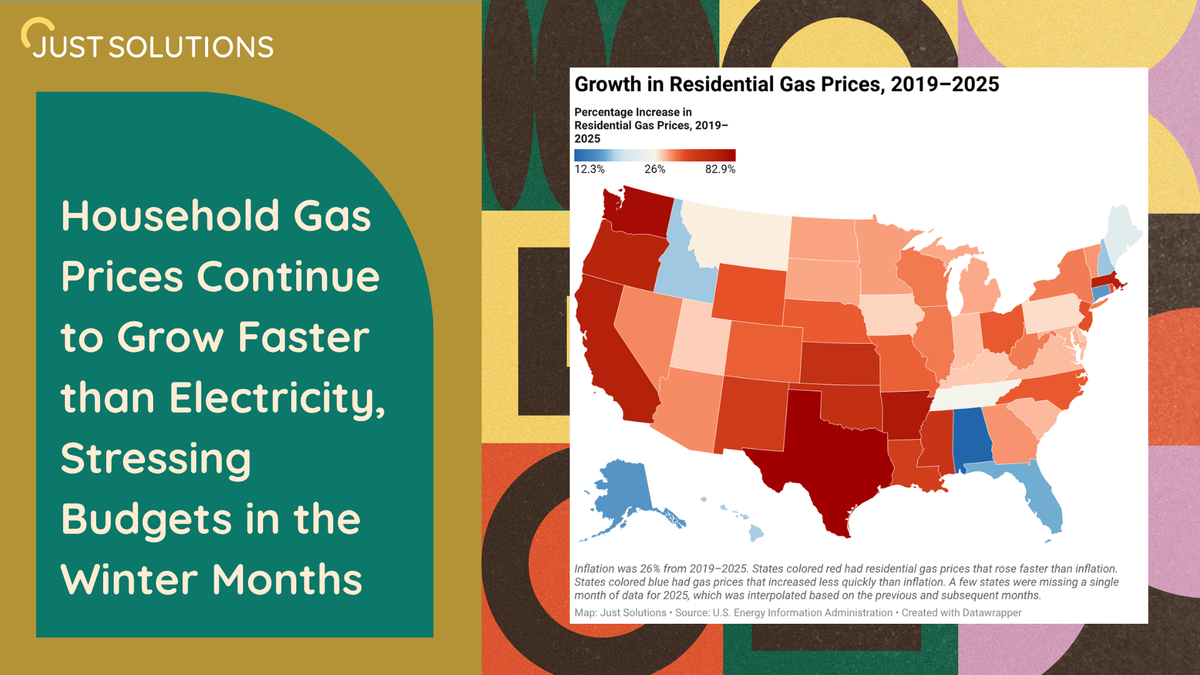
Residential gas price growth since 2019 exceeded inflation in 41 states and Washington, D.C., including by a staggering 83 percent in Texas, 79 percent in Washington state, and 74 percent in Arkansas (see the Figure below). California, over this time period, saw a 70 percent increase in both residential gas and electricity prices. Massachusetts residential gas prices also surged 70 percent. A few states saw very moderate growth in gas prices, but some of these—like Florida—are states with very little residential gas use and heating demand to begin with. From 2024 to 2025 alone, average national residential gas prices went up 5.8% for residential customers,[4] compared to inflation at 2.7%,[5] although a number of states saw single-year drops in prices (possibly due to when and how gas fuel prices are recovered in rates).
The state with the highest residential gas prices—Hawaii—also does not have many homes reliant on gas, and has low heating needs. Unfortunately, as an island state, it also has very high electricity prices and overall very high utility bills. The states with the highest overall residential gas prices are all over the country—with Florida (albeit with little total gas use), Massachusetts, Rhode Island, California, Georgia, Maine, Texas, Arkansas, and North Carolina rounding out the top ten (see Figure below).
About 60 percent of households in the United States use gas for any purpose,[6] primarily for space heating but also for hot water, cooking, and clothes dryers. Low-income households that use gas spend 10 percent of their income, on average, on utility bills—which can be an overwhelmingly high energy cost burden—and 40 percent of those bills are for gas.[7] But even these numbers obscure another truth: gas is disproportionately used in the winter months, meaning that utility bills often skyrocket in the winter, leading households to face difficult tradeoffs, whether to keep their home at safe temperatures and potentially forgo the ability to pay bills for energy, food, medicines, and rent.[8] Households use about half of all gas during just the three winter months, from December to February.[9]
Gas prices can also be quite volatile, and households are exposed to unexpected price shocks from wars, shifts in international demand for liquefied natural gas (LNG), and other global events. Changes in price of fuels are of course just the tail end of conflicts that create immense human suffering, lives lost, and homes destroyed. War has tremendous impacts first and foremost those involved, but the impacts are also globalized to everyone down the supply chain. Residential gas prices shot up over 20 percent in a single year after the war in Ukraine disrupted the international gas supply in 2022,[10] even though the US produces more gas than it uses.[11] But something worrisome happened after that: residential gas prices stayed high, even though wholesale supply prices dropped back down. More specifically, the average annual price that gas distribution companies paid for gas—called the Citygate price—dropped 30 percent between 2022 and 2025. But the prices households paid for gas in 2025 were four percent higher than in 2022.
The figure below shows the benchmark gas spot market supply price at Henry Hub,[12] the Citygate price paid by gas distribution utilities, and average residential gas prices over the last ten years. The way gas utilities pass fuel costs on to customers does vary from state to state, and in some cases, the price shocks from 2022 were showing up in bills in 2023 and even 2024. But by 2025, these fuel supply prices should have gone back down again.
Why is this happening? The American Gas Association reports that capital expenditures for gas utilities reached a record high of $49 billion in 2023, growing 50 percent from 2022 in the highest one-year percentage increase since the 1990s.[13] [14] The majority of this spending was spent on the gas distribution system[15]—such as building and maintaining gas pipelines. Although we do not have expenditures for more recent years, gas infrastructure spending has grown significantly in the last ten years and seems poised to continue.
Without policy change, residential gas prices overall also seem likely to continue to climb. The Center for American Progress has tracked $19 billion in rate hike requests (both requested and approved, including for residential, commercial, and industrial customers) from gas utility companies from January 2025–March 2026; the expected impact of these rate hikes is as high as $48.54/month (annual average), from an approved rate hike for Eversource utility customers in Massachusetts.[16] Given current federal policy priorities alongside the disruption of LNG exports from the Persian Gulf due to the U.S.-Israel-Iran war, LNG exports are likely to increase. LNG exports reached a record high in 2025,[17] with more planned. The country’s ninth LNG export terminal shipped its first cargo in April 2026,[18] and four more are under construction,[19] which is likely to put further strain on domestic gas prices.
Addressing these growing residential gas prices will likely take a multi-pronged approach. One of the first core strategies is to limit investments in new gas infrastructure, to ensure that households aren’t locked into paying for these investments over the coming decades. The risk is that these investments will become stranded assets, lying unused in the future after buildings electrify and switch to renewable energy, yet still on the books and requiring payback, driving up costs for the remaining households that have not yet electrified. These households are more likely to be lower income, renters, and others who are already facing higher energy cost burdens and are less able to afford the upfront costs of electrification.
Limiting gas investments requires oversight of spending on both new infrastructure and maintenance. New York, as an example, recently repealed the “hundred-foot rule”, which required utilities—and therefore all of the other gas customers—to pay for the first hundred feet of any new gas hookup. This decision reduces the rate impacts for gas customers and places the burden of paying for a gas hookup on the building instead, tilting the accounting decision in favor of electrification. In Maryland, the 2013 Strategic Infrastructure Development and Enhancement (“STRIDE”) Act permitted utilities to invest—and charge customers for—billions of dollars in pipeline maintenance for six decades, in direct conflict with the state’s greenhouse gas targets and with no evidence these investments improved safety.[20] To address these problems, the 2025 Next Generation Energy Act partially reins in these investments by requiring they demonstrate safety improvements, that alternatives are considered, that affected buildings are notified of opportunities to electrify, and that investments are in line with state policy.[^21]
Another core strategy to address unaffordable gas utility bills is to support weatherization and efficient electrification programs to reduce household demand for gas. Unfortunately, the Trump Administration has repeatedly proposed zeroing out the budget for the Low-Income Home Energy Assistance Program (LIHEAP),[21] which provides a lifeline for many households to pay for their energy bills (particularly in the winter). LIHEAP is already underfunded and only reaches 17 percent of eligible households,[22] but nearly half of its funding is used to help households pay specifically for winter heating.[23] Electrification with heat pumps improves efficiency and may enable households to switch away from gas use entirely, but the upfront costs can be prohibitive—requiring incentives or financing to reduce barriers to adoption (see, for example, the TECH Clean California Program),[24] as well as adoption of heat pump-specific electric rates in places where high electricity costs may make electric heating unaffordable, which Massachusetts recently introduced.[25] Unfortunately, many states are actually moving away from energy efficiency programs, in the name of reducing the impact of program costs on bills in the short-term, even though these programs provide long-term bill savings as well as grid-wide benefits.[26]
The risks of making these short-term decisions would become more apparent if states undertook holistic long-term gas infrastructure planning. As an example, under SB 1221 (2024), California is identifying “neighborhood decarbonization zones” where entire sections of the gas distribution grid will be “pruned” simultaneously, and all affected buildings electrified.[27] This approach is meant to usher in an orderly transition of the gas infrastructure, such that money is not wasted on pipeline maintenance for pipes that might soon be retired anyway, and that an entire section of pipeline does not have to be maintained just to serve a handful of households. Massachusetts launched the Future of Gas initiative in 2020 to help the state achieve its greenhouse gas targets, reduce its reliance on gas, and maintain affordability, although it is now working to ensure its utilities are effectively complying with the utility commission’s guidelines.
Across the country, states are facing a pressing need to address affordability for both electricity and gas—but need to do so in a way that prevents the same problems from coming back to haunt us in the coming years. Ensuring that short-term planning and investments align with long-term affordability and climate goals will help protect households from growing and volatile residential gas prices throughout the clean energy transition.
U.S. Energy Information Administration. U.S. Natural Gas Number of Customers. Accessed: May 4, 2026. ↩︎
U.S. Energy Information Administration. Electricity Data Browser. Accessed: May 1, 2026. ↩︎
U.S. Energy Information Administration. Natural Gas Prices. Accessed: May 1, 2026. ↩︎
U.S. Energy Information Administration. Natural Gas Prices. Accessed: May 1, 2026. ↩︎
U.S. Inflation Calculator. Current U.S. Inflation Rates (2000-2026). Accessed: May 4, 2026. ↩︎
U.S. Energy Information Administration. Natural Gas Explained. Accessed: May 1, 2026. ↩︎
U.S. Department of Energy. LEAD Tool. Accessed: May 1, 2026. ↩︎
Makhijani, A. (2025). The High Economic, Social, and Health Costs of Unaffordable Energy. Just Solutions. ↩︎
U.S. Energy Information Administration. U.S. Natural Gas Residential Consumption. Accessed: May 1, 2026. ↩︎
U.S. Energy Information Administration. Natural Gas Prices. Accessed: May 1, 2026. ↩︎
U.S. Energy Information Administration. U.S. Energy Facts Explained. Accessed: May 1, 2026. ↩︎
Henry Hub is one of ten methane gas distribution hubs and is frequently used as a standard reference point for gas supply spot prices. ↩︎
American Gas Association. (2025). Gas Utility Construction Capital Expenditure. ↩︎
Spending grew 44 percent from 2022 to 2023 when adjusting for inflation. 2022 spending was lower than previous few years, reflecting the variability in annual infrastructure spending. ↩︎
American Gas Association. (2024). Section 12: Construction Expenditures. ↩︎
Thyagarajan, A., Friedman, J., and Levin, A. (2026). Electric and Natural Gas Utility Rate Hikes Tracker. Center for American Progress. (Accessed May 1, 2026). ↩︎
U.S. Energy Information Administration. Liquefied U.S. Natural Gas Exports. Accessed: May 4, 2026. ↩︎
Young, J. (2026). The 9th U.S. liquefied natural gas export terminal, Golden Pass, ships first cargo. Today in Energy. U.S Energy Information Administration. ↩︎
Young, J. (2025).North America’s LNG export capacity could more than double by 2029. Today in Energy. U.S Energy Information Administration. ↩︎
Makhijani, A. (2023). The Trouble with STRIDE: Meeting climate goals and addressing natural gas system stranded costs. Abell Reports.
[^21] Maryland General Assembly. (2025). Next Generation Energy Act. (S.B. 937). ↩︎Frazin, R. (2026). Trump re-ups push to eliminate low-income heating assistance program LIHEAP. The Hill. ↩︎
LIHEAP. (2025). Low Income Home Energy Assistance – FY2024 National Profile (All States). ↩︎
Comstock, O. and Lawson, G. (2025). Electricity use is becoming more common for residential heating. Today in Energy. U.S. Energy Information Administration. ↩︎
Energy Solutions. (2026). TECH Clean California Program. ↩︎
Shemkus, S. (2026). New winter rates saved at least $37M for Massachusetts heat-pump owners. Canary Media. ↩︎
Plumer, B. (2026). Northeast States Set Big Climate Goals. Now Those Plans Are in Trouble. The New York Times. ↩︎
California Public Utilities. Commission. SB 1221 Implementation. Accessed: May 3, 2026. ↩︎